San Diego area · Observational analysis · Revised 24 September 2026

Heat and arrest records

Daily temperature and supplied San Diego-area arrest records, July 2018–December 2025. General findings, separate charge categories, and a domestic violence report.

Corrected weather · Available 64-ZIP sample · 2021–2024

The association remains inconclusive.

The corrected reference estimate includes no association within its confidence interval (two-sided p = 0.05287). Three sensitivity tests cross 0.05 individually; none crosses 0.05 after correction across all 24 revision tests. These records do not establish that heat increases crime or violence.

+1.91%

per 10°F higher daily maximum

95% CI −0.02% to +3.88%

57,903 eligible record groups · 64 fitted ZIP areas
01

Revised analyses and original reference

2021–2024. Corrected local calendar-day weather and additional sensitivity analyses, with the full original estimates retained for comparison.

The revision uses 64 ZIP areas with complete hourly weather downloads. Acquisition prioritized areas with more source rows before the provider’s quota was reached; availability is not random. The original and corrected weather comparisons below use the same available ZIP sample. No result was selected for display because of statistical significance.

Expected daily record-count ratio per 10°F higher maximum; individual 95% confidence intervals. Raw two-sided p-values are shown here.
OutcomeAnalysisCount ratio95% CIRaw pGroupsFitted ZIPs
All eligible recordsFull original reference1.018730.99952–1.038320.0560858,770106
All eligible recordsSame available ZIPs · original weather (R00)1.019070.99976–1.038760.0529257,90364
All eligible recordsSame available ZIPs · civil-day weather (R0)1.019070.99977–1.038760.0528757,90364
Core domestic violenceFull original reference1.028880.98952–1.069810.152586,63795
Core domestic violenceSame available ZIPs · original weather (R00)1.027360.98762–1.068690.179936,50163
Core domestic violenceSame available ZIPs · civil-day weather (R0)1.027410.98768–1.068730.179036,50163

The full original reference uses its original eligibility rules and all informative ZIPs in the 112-ZIP weather universe. Comparing it with R00 shows the sample change; comparing R00 with R0 isolates the weather-day revision within that sample. These are administrative record groups, not unique persons or population crime rates.

General-record temperature associations across revised linear modelsAll eligible records, 2021–2024. Corrected civil-day reference: +1.91% per 10°F, individual 95% confidence interval −0.02% to +3.88%. Nine linear specifications are shown; samples and controls differ. Exact estimates and hypothesis tests follow in the results tables.SpecificationChange and individual 95% CI−6%−4%−2%0%+2%+4%+6%R0: Corrected civil-day reference, +1.91%; 95% CI −0.02% to +3.88%; 57,903 groups, 64 ZIPs.R0 · Corrected civil-day reference+1.91% (−0.02% to +3.88%)R1: Previous-day maximum, +1.14%; 95% CI −0.78% to +3.10%; 57,903 groups, 64 ZIPs.R1 · Previous-day maximum+1.14% (−0.78% to +3.10%)R2: Rainfall, humidity and holidays, +0.23%; 95% CI −2.31% to +2.83%; 57,903 groups, 64 ZIPs.R2 · Rainfall, humidity and holidays+0.23% (−2.31% to +2.83%)R3: Local annual seasonality, +2.30%; 95% CI +0.31% to +4.34%; 57,903 groups, 64 ZIPs.R3 · Local annual seasonality+2.30% (+0.31% to +4.34%)R4: Warrant co-charges excluded, +2.27%; 95% CI +0.41% to +4.17%; 52,203 groups, 64 ZIPs.R4 · Warrant co-charges excluded+2.27% (+0.41% to +4.17%)R5: Combined controls and exclusions, +1.16%; 95% CI −1.51% to +3.91%; 52,203 groups, 64 ZIPs.R5 · Combined controls and exclusions+1.16% (−1.51% to +3.91%)R7: ERA5-Land · station subset, +0.09%; 95% CI −3.53% to +3.86%; 33,527 groups, 46 ZIPs.R7 · ERA5-Land · station subset+0.09% (−3.53% to +3.86%)R8: NOAA maximum · station subset, −0.29%; 95% CI −3.62% to +3.16%; 33,527 groups, 46 ZIPs.R8 · NOAA maximum · station subset−0.29% (−3.62% to +3.16%)R9: Civil-day duration adjustment, +1.90%; 95% CI −0.03% to +3.87%; 57,903 groups, 64 ZIPs.R9 · Civil-day duration adjustment+1.90% (−0.03% to +3.87%)Change in expected daily record count per 10°F
Corrected reference R0: +1.91% per 10°F (individual 95% CI −0.02% to +3.88%). R1 uses the previous day’s maximum; R7 and R8 use the same smaller station-matched sample. R9 adjusts for civil-day duration. R6 is nonlinear and has no single per-10°F ratio; its tests appear below. Intervals are individual, not simultaneous.
All eligible records · all 11 revision specifications and 12 hypothesis tests
2021–2024 · Linear count ratios are per 10°F. R6 reports separate joint-temperature and nonlinearity tests.
SpecificationCount ratioIndividual 95% CIRaw pHolm pGroupsFitted ZIPsFitted ZIP-days
R00 · Original weather · same ZIP sample
Released fixed UTC−7 weather on the same available ZIPs as R0.
1.019070.99976–1.038760.052921.0000057,9036493,504
R0 · Corrected civil-day reference
Actual local calendar-day maximum; original eligibility and calendar controls.
1.019070.99977–1.038760.052871.0000057,9036493,504
R1 · Previous-day maximum
Previous civil calendar-day maximum; otherwise R0.
1.011370.99216–1.030960.247931.0000057,9036493,504
R2 · Rainfall, humidity and holidays
R0 plus rainfall, relative humidity and observed federal holidays.
1.002280.97693–1.028290.861761.0000057,9036493,504
R3 · Local annual seasonality
R0 plus ZIP-specific annual sine and cosine terms.
1.023051.00312–1.043360.023170.5328657,9036493,504
R4 · Warrant co-charges excluded
R0 after excluding groups carrying a warrant-related co-charge.
1.022751.00410–1.041750.016600.3984452,2036493,504
R5 · Combined controls and exclusions
Weather and holiday controls, local seasonality and warrant co-charge exclusion.
1.011590.98485–1.039060.399041.0000052,2036493,504
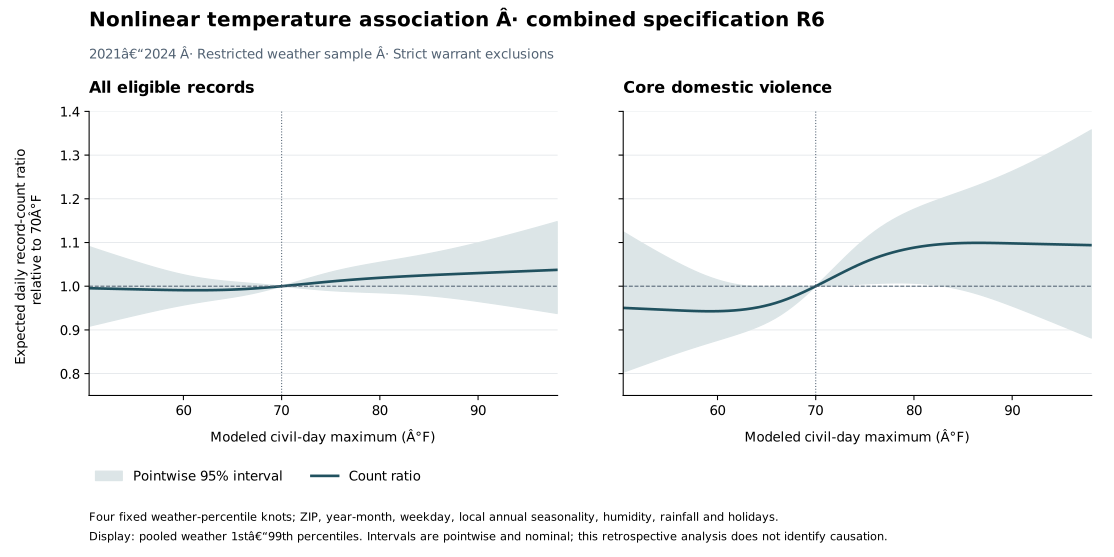
R6 · Nonlinear temperature · combined controls
Restricted cubic spline with the R5 controls and exclusions.
Nonlinear curveNo single 10°F contrast; see curveJoint: 0.74827
Nonlinearity: 0.84141
Joint: 1.00000
Nonlinearity: 1.00000
52,2036493,504
R7 · ERA5-Land · station subset
R5 restricted to the station-matched dates and ZIPs used by R8.
1.000950.96466–1.038600.959941.0000033,5274666,829
R8 · NOAA maximum · station subset
Same rows and controls as R7, using quality-screened NOAA daily maximum.
0.997130.96383–1.031580.868161.0000033,5274666,829
R9 · Civil-day duration adjustment
R0 with an offset for the civil day’s 23, 24 or 25 hours.
1.019050.99975–1.038720.053121.0000057,9036493,504
Core domestic violence · all 11 revision specifications and 12 hypothesis tests
2021–2024 · Linear count ratios are per 10°F. R6 reports separate joint-temperature and nonlinearity tests.
SpecificationCount ratioIndividual 95% CIRaw pHolm pGroupsFitted ZIPsFitted ZIP-days
R00 · Original weather · same ZIP sample
Released fixed UTC−7 weather on the same available ZIPs as R0.
1.027360.98762–1.068690.179931.000006,5016392,043
R0 · Corrected civil-day reference
Actual local calendar-day maximum; original eligibility and calendar controls.
1.027410.98768–1.068730.179031.000006,5016392,043
R1 · Previous-day maximum
Previous civil calendar-day maximum; otherwise R0.
1.041391.00112–1.083290.043840.964476,5016392,043
R2 · Rainfall, humidity and holidays
R0 plus rainfall, relative humidity and observed federal holidays.
1.040250.98324–1.100570.170001.000006,5016392,043
R3 · Local annual seasonality
R0 plus ZIP-specific annual sine and cosine terms.
1.031390.98951–1.075040.143901.000006,5016389,125
R4 · Warrant co-charges excluded
R0 after excluding groups carrying a warrant-related co-charge.
1.024770.98563–1.065470.218161.000006,4356392,043
R5 · Combined controls and exclusions
Weather and holiday controls, local seasonality and warrant co-charge exclusion.
1.048450.98840–1.112160.115901.000006,4356389,125
R6 · Nonlinear temperature · combined controls
Restricted cubic spline with the R5 controls and exclusions.
Nonlinear curveNo single 10°F contrast; see curveJoint: 0.18132
Nonlinearity: 0.31266
Joint: 1.00000
Nonlinearity: 1.00000
6,4356389,125
R7 · ERA5-Land · station subset
R5 restricted to the station-matched dates and ZIPs used by R8.
1.065340.97895–1.159350.142381.000003,8094663,936
R8 · NOAA maximum · station subset
Same rows and controls as R7, using quality-screened NOAA daily maximum.
0.978870.91154–1.051160.556821.000003,8094663,936
R9 · Civil-day duration adjustment
R0 with an offset for the civil day’s 23, 24 or 25 hours.
1.027390.98767–1.068710.179231.000006,5016392,043

Fitted ZIP counts omit areas with no outcome records. Some DV specifications with local seasonal terms also remove zero-count rows identified by separation checks; all positive outcome groups are retained. ZIP-day counts describe the fitted rows for each specification. The corrected reference R0 is unaffected by that numerical amendment. Numerical amendment and separation checks.

All 24 revision tests across both outcomes receive one Holm correction, including R00 and both R6 hypotheses. None meets the adjusted 0.05 threshold. The revision is retrospective and responds to methodological feedback; it was not preregistered. Original full-sample comparison families remain separate. Individual 95% intervals are not multiplicity-adjusted, and a non-significant result does not establish equivalence or absence of association.

View nonlinear temperature curves and pointwise intervals · Download complete revision results · JSON

02

Record explorer

All supplied source-ID groups, including records outside the weather model. Selected charge categories overlap: one group may appear in several categories. Do not add category counts together.

136,313 source-ID groups · overlapping selected charge categories

2018 is partial; 2025 is incomplete. Conflicting-year groups are retained separately. Counts are record units, not verified individual arrests.

All available years · Source-ID groups · Categories overlap
YearAll recordsCore DVDrug / paraphernaliaProperty-relatedOther assault / threatsWeapons-relatedDriving-related
201812,0929883,2951,6536614151,030
201924,7601,9477,0003,3631,2267592,165
202018,5891,8386,1202,6351,3288051,566
202119,0181,8756,0462,8191,3399721,493
202218,3171,6745,2162,8131,2857971,590
202318,0961,6824,9662,3651,3017641,676
202417,1211,5744,4291,9661,2546511,514
20258,2839002,0831,056678285989
MULTIPLE/CONFLICTING3701710251
03

Daily temperature and record counts

ZIP-day aggregates for the weather-eligible population. Includes adult records with unambiguous dates and ZIPs, excluding warrant subtypes and detention/court categories.

These unadjusted views do not reproduce the adjusted models. Counts use a narrower population than the record explorer. Categories overlap and are selected charge indicators, not exhaustive crime classifications. All-area temperatures are unweighted averages of the selected ZIP points, not measured county extrema.

Corrected local calendar-day weather is available for 64 ZIPs. The provider’s acquisition quota prevented completing the remaining 48; this is a restricted sample, not complete regional coverage. Counts retain the original eligibility rules; expanded warrant exclusions appear only in the designated models.

Daily data load on request. Default period: 2021–2024.

04

Methods and interpretation

Record definitions, exposure assignment, model specification, and limits.

Question, outcome and scope

Do hotter dates coincide with more eligible arrest-record groups in the supplied San Diego-area exports? The outcome is administrative arrest-record activity. It does not measure all crime, victimization, calls for service, unique people, convictions or verified offenses occurring that day. Reporting, police response, enforcement and recordkeeping all intervene between offending and an arrest record.

The original full-sample 2021–2024 reference remains available: 58,770 eligible groups, 106 fitted ZIPs and 154,866 ZIP-days; +1.87% per 10°F, 95% CI −0.05% to +3.83%, two-sided p = 0.05608. This is inconclusive at 0.05. The original core-DV reference is +2.89%, 95% CI −1.05% to +6.98%, p = 0.15258, from 6,637 groups. Nonsignificance does not establish equivalence or prove no association. Original general results, original DV results.

Methodological amendment and sample restriction

The amendment corrects weather-day alignment and evaluates a fixed set of robustness checks. The initial estimates and feedback were already known when the plan was written; this remains retrospective analysis, not preregistration. The full plan, acquisition amendment and all results are disclosed. Revision plan, coverage amendment, issue-by-issue response.

The weather provider reached its daily acquisition quota after 64 of 112 ZIPs had complete hourly temperature and humidity data. Those 64 also have complete precipitation and prior-day exposures. They contain 57,903 of 58,770 general groups (98.5%) and 6,501 of 6,637 core-DV groups (98.0%) in the original eligible sample. Acquisition availability is not random. Missing ZIPs are listed; their weather was not imputed or mixed with the corrected series. The original 112-ZIP data remain an explicitly historical download.

The revised base panel contains 93,504 ZIP-days: 64 ZIPs × 1,461 dates. Individual model samples can be smaller, as documented in the results. Comparing original weather with corrected weather on these same ZIPs isolates the exposure substitution from sample composition. Comparing either restricted estimate directly with the original full-sample estimate also changes geography. The revised daily explorer uses the 64 corrected ZIPs; the record explorer continues to summarize the full supplied release. Sample metadata, weather acquisition and verification.

Records, provenance and classification

The three CSVs contain 214,745 rows. Four invalid rows are excluded, leaving 214,741 charge lines, including 926 exact duplicates. Grouping identifiers within their originating export produces 136,313 source-ID groups, so additional charges or identical lines do not automatically add records. This unit is not independently validated as one arrest, person or offense. Original source reconstruction.

ExportIdentifier headerRecorded date header
July 2018–December 2023Incident NumberIncident Date_Time
2024Incident NumberArrest Date/Time
2025Arrest Ref NbrArrest Date/Time

The identifier changes in 2025, not 2024. Every 2024 and 2025 charge row has Agency = SHERIFF; the older file has no Agency column. These observed labels do not authenticate the release or establish its query, completeness or municipal coverage. No matching agency response letter, extraction specification or export-specific dictionary was located. Provenance review and exact headers.

Official Sheriff monthly arrest reports use exclusions for detention, court and non-Sheriff activity, PC 849.5 detentions and records still under review. Their units and filters cannot be equated to these exports without an agency crosswalk. Candidate-filter comparisons are documented without claiming a completeness percentage. Regional NetRMS hosting also does not establish which agencies an export includes. Official July 2023 activity report, comparison table.

Groups with conflicting metadata remain flagged: 37 conflict on year, 121 on month, 172 on date and 419 on ZIP. Conflict counts overlap. Exposure assignment requires an unambiguous recorded date and ZIP; no arbitrary first value resolves a conflict. The locality label SHERIFF is administrative, not a city. City totals lack harmonized agency coverage and population denominators.

Selected charge categories are nonexclusive: core DV, drug/paraphernalia, property-related, other assault/battery/threats, weapons and driving-related. One group may enter several categories. Their counts cannot be added as unique events, and they are not FBI violent/property-crime classifications. Charges are allegations. Exact rules and statutory sources, category definitions.

Eligibility and warrants

The reference includes exclusively ADULT groups with unique usable dates and ZIPs, matched weather, no warrant subtype and no detention/court command or area classification. The supplied period starts July 2018; no 2026 file exists. 2025 is excluded from all reference and revision models: 79 dates have no raw source rows, and early-year sparsity is not evidence of zero arrests. Continuous dates in other years still do not prove completeness.

Independent reporting qualification. DOJ’s June 2026 documentation identifies incomplete San Diego County Sheriff reporting in November–December 2024 and January–June 2025 for its arrest and DV-call datasets. The current models retain the two flagged 2024 months. This strengthens the concern about reporting completeness but does not identify which supplied records are missing or establish why. No numerical correction or imputation follows from this notice. The separately published source supplement documents this new evidence; the displayed estimates remain the versioned results described here. DOJ arrest context, p. 7, independent source supplement.

An expanded warrant screen checks every co-charge against the reviewed exact warrant codes. In the full original primary sample, it removes 5,781 general groups and 67 primary core-DV groups, leaving 52,989 and 6,570. In the 64-ZIP revision sample it removes 5,700 general and 66 core-DV groups, leaving 52,203 and 6,435. Original and stricter samples are both reported; the stricter result is not substituted because of its p-value. The screen deliberately retains the statutory “without warrant” counterexample. It does not identify every delayed arrest or verify offense timing. Warrant audit, exact code list.

Civil-day weather and exposure uncertainty

Revised temperatures come from ERA5-Land hourly data, requested at the same Census ZCTA representative points and elevations as the original analysis. UTC timestamps are grouped into America/Los_Angeles civil dates using historical timezone rules. High and low are hourly extrema; mean is the arithmetic mean of all 23, 24 or 25 hourly values in that local date. Humidity uses the same hourly source. Precipitation is explicitly from the coarser ERA5 product because this provider’s ERA5-Land precipitation field was unavailable. Hourly precipitation accumulations are assigned by their interval endpoints. Open-Meteo documentation, ERA5-Land, Census Gazetteer.

The original daily API used fixed UTC−7. The starting midnight differs on 509 primary-period dates; comparing both boundaries identifies 513 changed day windows, including four spring and four autumn transition dates. Spring and autumn boundary tests and independent regrouping verify the revised series. The 64 ZIPs share 37 temperature grids and 15 precipitation grids; they are not 64 independent weather instruments. Weather validation, temperature differences.

The original six-station comparison found daily-maximum mean absolute differences of 2.6–5.9°F, and a modeled-minimum warm bias of 6.8°F at Ramona. Model error, elevation, grid smoothing and observation-day conventions contribute. These values are agreement checks, not a correction formula for every ZIP. Revised station sensitivities assign the geographically nearest of the six stations, then require distance ≤25 km and elevation difference ≤200 m. Quality-invalid or missing station maxima are removed identically from the paired station and modeled-weather fits. NOAA quality documentation, station assignments.

Same-day maximum can occur after a morning record. Previous-day maximum is therefore examined separately. Neither day alignment nor lagging can establish an unknown offense date, indoor exposure or personal heat dose. Remaining weather/linkage uncertainty is not included in the model confidence intervals.

Mean model and uncertainty

The reference mean model is

log⁡μzd=αz+γm(d)+δw(d)+β Tzd−7010,μzd=E⁡ ⁣[Yzd∣xzd].\begin{aligned} \log \mu_{zd} &= \alpha_z + \gamma_{m(d)} \\ &\quad + \delta_{w(d)} + \beta\,\frac{T_{zd}-70}{10}, \\ \mu_{zd} &= \operatorname{E}\!\left[Y_{zd}\mid\mathbf{x}_{zd}\right]. \end{aligned}

Here, YzdY_{zd} is the eligible record-group count for ZIP zz and recorded date dd; μzd\mu_{zd} is its conditional expected count; TzdT_{zd} is the specified daily maximum in °F. The functions m(d)m(d) and w(d)w(d) denote year-month and weekday. The covariates xzd\mathbf{x}_{zd} include temperature and the stated geographic/calendar controls. The count ratio per 10°F is exp⁡(β)\exp(\beta). Centering at 70°F changes intercepts only.

Poisson is used as a conditional-mean model. Excess variability is addressed with sandwich covariance; many zeros alone do not justify a separate zero-inflated model. Observed and model-implied zero fractions, residual dependence and dispersion are disclosed as diagnostics, not proof of a correct mean specification. ZIPs with zero outcomes throughout a fitted sample are omitted from that fit and remain in descriptive denominators. Independent methods review.

Scores are summed across all ZIPs within each calendar date before Bartlett Newey–West covariance with seven daily lags. All 1,461 dates remain in the score sequence, including dates without station-model rows. Thus, same-day spatial dependence and cross-ZIP lagged dependence enter the covariance; ZIP-days are not assumed independent. The factor n/(n−k)n/(n-k) uses fitted rows nn and parameters kk. HAC14 and HAC28 checks are also reported for the corrected reference and combined specification. Newey and West, Driscoll and Kraay.

Additional controls, nonlinearity and multiplicity

The fixed revision battery adds observed federal holidays, log(1 + daily precipitation in mm), mean relative humidity, and ZIP-specific annual sine/cosine seasonality, separately and together. An elapsed-day offset, log⁡(hd/24)\log(h_d/24), is a separate sensitivity: proportional event opportunity across a 23/25-hour day is an assumption, especially when the repeated/lost hour is nighttime.

The nonlinear model replaces the linear temperature term with a restricted cubic spline using four weather-only percentile knots, fixed across outcomes. It reports both the overall temperature test and a separate curvature test. Pointwise curve intervals are not simultaneous bands, and a nonsignificant curvature test does not establish linearity. Specification labels, exact controls, sample sizes, convergence and all tests accompany the results.

ZIP-specific seasonal effects produced exact Poisson separation in two sparse DV ZIPs. A documented extended-MLE calculation removes only certified zero-count rows whose limiting fitted means are zero, retains every positive outcome, and removes seasonal columns then redundant with ZIP intercepts. This numerical correction follows the diagnosed fitting failure; no event-count cutoff or penalty is introduced. Descriptive zero-day denominators remain unchanged. Per-model removal counts and certificates are public. Numerical amendment.

The revised plan contains 22 fits and 24 temperature hypotheses across both outcomes, including same-sample original-weather comparisons. Holm correction covers this entire revision family. Nominal intervals remain individual 95% intervals. All revised tests are exploratory/retrospective; neither nominal significance in one model nor selecting a favorable specification creates confirmatory evidence. Original testing families remain disclosed separately. Frozen plan and amendment, Holm (1979).

Denominators and remaining confounding

The estimand concerns counts per ZIP-day, not risk per resident. Adding a constant population offset log⁡(Pz)\log(P_z) cannot change the temperature coefficient when unrestricted ZIP intercepts are present: it is absorbed into αz\alpha_z. A Census denominator does not measure daily visitors, commuters or changing police coverage. A total-arrest offset asks a different composition question and could condition on temperature-related enforcement activity.

The new controls address specified calendar and weather differences; they do not establish exchangeability. Tourism, local events, school schedules, staffing, economic conditions, reporting and individual circumstances remain incompletely measured. Some variables may lie on a causal pathway rather than be appropriate controls. The analysis cannot identify the effect of heat on underlying crime or violence.

Reproducibility and agency-dependent questions

Original hashes and published numerical outputs are retained. Revised weather aggregates, model inputs, estimates, code, diagnostics, station assignments and source references are public; record identifiers, street locations and individual timestamps remain private. Independent numerical checks validate processing, not source authenticity, completeness or external validity. Computational audits are not external human peer review. Reporting follows relevant STROBE and SAMPL principles. STROBE, SAMPL.

A prepared agency request asks for the original extraction/query, agency selection, same-query control totals, source-ID cardinality, timestamp and City/ZIP definitions, schema changes, and the reason for 2025 gaps. It has not been sent. Those questions require documented agency answers; no statistical adjustment can supply them. Clarification request draft.

05

Independent sources and coverage

Official reporting qualifications, additional crime records and observed weather. Retrieved 24 September 2026.

The refresh checked 133 resources: 131 responses and two access failures. Current Sheriff monthly-report contents remain unverified after direct access failures; the full Open-Meteo reanalysis panel was not reacquired. The earlier source inventory below remains dated to its original acquisition. Exact retrieval and comparison record.

These sources extend the research material beyond the supplied files. Calls, reported offenses, arrest statistics and source-ID groups have different definitions. Each remains a separate series. The added data have not been used to refit the displayed models or change their p-values.

Acquired sources and their analytic uses
SourceCoverage acquiredUse and limitationDocumentation
California DOJCounty arrests: 1980–2025. Agency DV-call reports: 2001–2025.Annual arrest/citation totals and monthly DV reports are separate benchmarks. Documented Sheriff reporting gaps; county totals include multiple agencies.Source audit
SANDAG / ARJIS CIBRS2021–23 September 2026; agency-specific endpoints vary.Group A supplies an explicit DV indicator. Group B DV values are all missing. Public releases are described as samples; coverage is not certified.Source audit
San Diego Police NIBRS2020–23 September 2026.Daily reported offense counts for a different jurisdiction. Distinct offense identifiers are reconciled; incident counts cannot be summed across offense categories.Source audit
SANDAG historical DV series37 annual values, 1986–2022.The actual downloaded years differ from the chart title. Historical context only; do not splice to modern incident data or use annual totals for daily heat inference.Source audit
NOAA daily stations29 stations; 1991–2025 archive extract.25 stations meet the 2021–2024 maximum-temperature coverage rule. Six support a 1991–2020 warm-season baseline. Observation days differ from civil days.Source audit
NOAA subdaily observations12 stations; 2021–2024.379,574 accepted hourly samples; 13,235 complete station-days. High and low are sampled extrema; means require every civil hour.Source audit
Census municipal context2020 population for nine Sheriff contract cities.Population context only. Ambiguous recorded localities and agency coverage prevent municipal arrest-risk denominators.Source audit
What this adds to the Vista comparison

Official Census counts are similar for Vista (98,381) and San Marcos (94,833) in 2020. Population size alone does not explain the large difference in the supplied totals. Both cities contract with the Sheriff, whose station service areas also include unincorporated territory. Until the recorded location and agency coverage are resolved, city totals cannot be interpreted as municipal crime rates.

Jurisdiction evidence and Census extraction · Municipal population context · CSV

How the findings relate to published research

A 2025 New Orleans study found higher odds of DV-related calls during sustained extreme heat. A Los Angeles study reported variation in the heat–crime association by neighborhood poverty. These findings support the research question; different outcomes, exposures and settings prevent treating them as replications of the supplied arrest-record analysis.

Dey et al., JAMA Network Open (2025) · Heilmann et al., Journal of Public Economics (2021) · Primary-source review and requirements for further analysis

06

Data and sources

Aggregate data, reproducible calculations, source documentation, and unresolved questions.

Original release and category documentation

The original full-sample results use fixed UTC−7 weather. These files are retained unchanged for comparison and reproducibility.

Source documentation and provenance

The arrest exports were supplied by the requester. No response letter, extraction query, or export-specific dictionary was available. Agency labels and comparisons with official reports cannot independently establish completeness. Source review and official documentation; original filenames, hashes and metadata.